The short answer
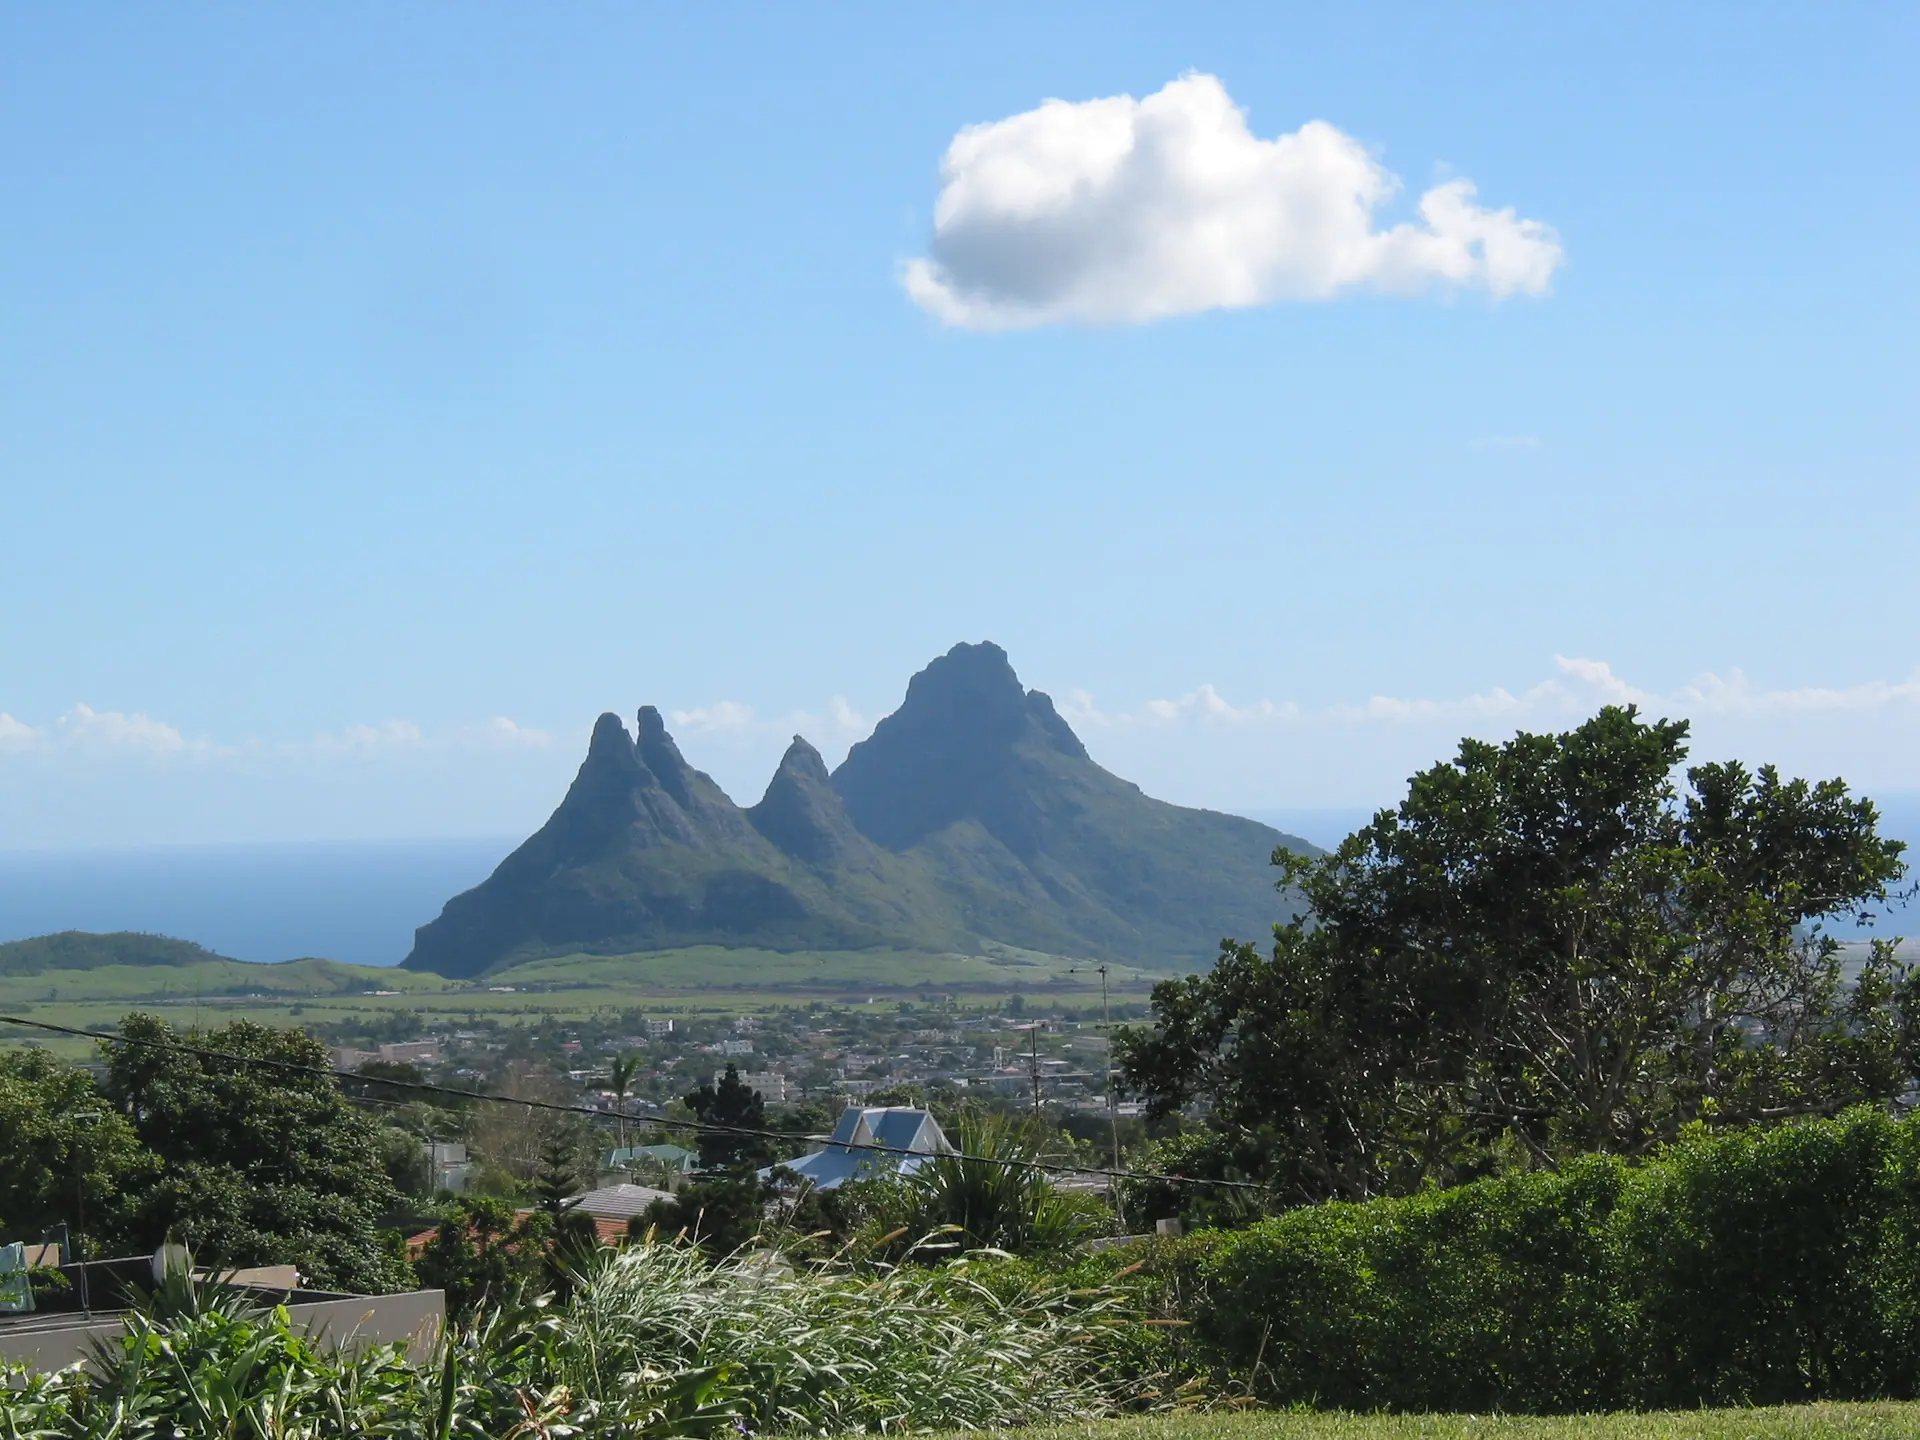
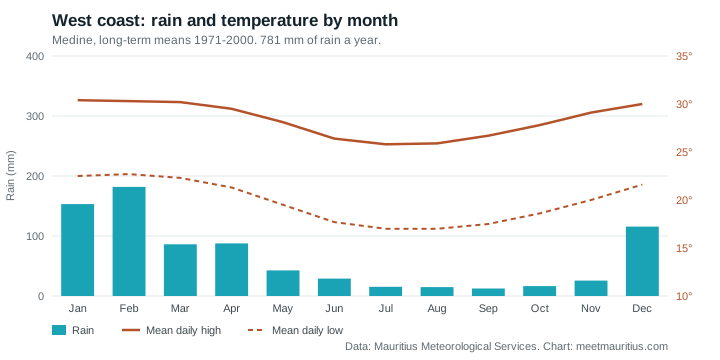
Where you stay matters as much as when you go. The west coast gets 781 mm of rain a year; the central plateau, a short drive inland, gets 1,996 mm, more than twice as much, over 179 rain days against 64. In all five regions February is the wettest month and September to November are among the driest.
Long-term means for 1971-2000 from the Mauritius Meteorological Services, one station per region. Copied and checked on . Averages, not a forecast.
The five regions at a glance
| Region | Station | Rain a year | Rain days | Wettest month | Driest month | Warmest high | Coolest low |
|---|---|---|---|---|---|---|---|
| West coast | Medine | 781 mm | 64 | February (182 mm) | September (13 mm) | 30.4°C | 17°C |
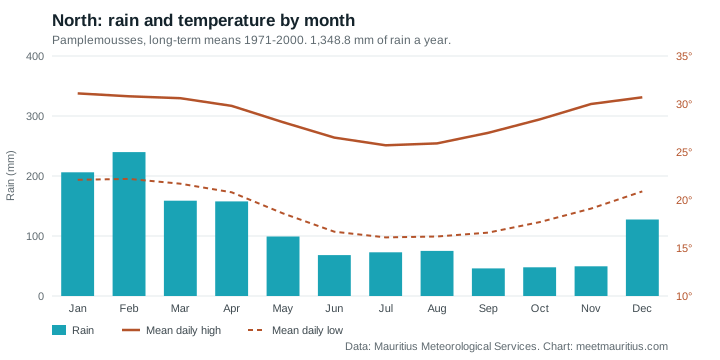
| North | Pamplemousses | 1,349 mm | 148 | February (240 mm) | September (46 mm) | 31.1°C | 16.1°C |
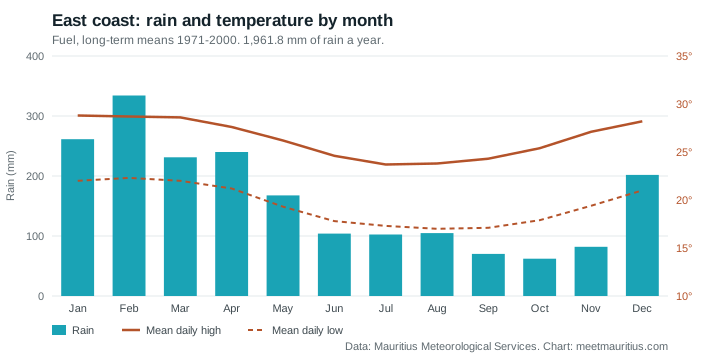
| East coast | Fuel | 1,962 mm | 173 | February (334 mm) | October (62 mm) | 28.8°C | 17°C |
| South | Plaisance | 1,723 mm | 166 | February (267 mm) | September (60 mm) | 29.8°C | 17.8°C |
| Central plateau | Vacoas | 1,996 mm | 179 | February (400 mm) | October (63 mm) | 27.6°C | 15.1°C |
Rain days are days with more than 1 mm of rain. Central plateau has the coolest nights.
Driest region in each month
- January West coast 153 mm
- February West coast 182 mm
- March West coast 86 mm
- April West coast 88 mm
- May West coast 43 mm
- June West coast 29 mm
- July West coast 15 mm
- August West coast 15 mm
- September West coast 13 mm
- October West coast 17 mm
- November West coast 26 mm
- December West coast 116 mm
West coast (Medine)
| Month | High | Low | Sunshine | Rain | Rain days | Humidity | Wind |
|---|---|---|---|---|---|---|---|
| January | 30.4°C | 22.5°C | 7.5 h/day | 153.2 mm | 9 | 80% | 7.6 km/h |
| February | 30.3°C | 22.7°C | 7.4 h/day | 181.8 mm | 10 | 82% | 9.5 km/h |
| March | 30.2°C | 22.3°C | 7.3 h/day | 86.2 mm | 8 | 80% | 7.6 km/h |
| April | 29.5°C | 21.3°C | 7.2 h/day | 87.6 mm | 8 | 80% | 9.5 km/h |
| May | 28.1°C | 19.5°C | 7.8 h/day | 42.7 mm | 5 | 78% | 11.4 km/h |
| June | 26.4°C | 17.7°C | 7.6 h/day | 29 mm | 4 | 78% | 15.2 km/h |
| July | 25.8°C | 17°C | 7.6 h/day | 15.4 mm | 3 | 77% | 15.2 km/h |
| August | 25.9°C | 17°C | 7.6 h/day | 14.8 mm | 3 | 76% | 17.1 km/h |
| September | 26.7°C | 17.5°C | 7.3 h/day | 12.5 mm | 2 | 76% | 15.2 km/h |
| October | 27.8°C | 18.6°C | 7.8 h/day | 16.5 mm | 2 | 76% | 13.3 km/h |
| November | 29.1°C | 20°C | 8 h/day | 25.7 mm | 3 | 77% | 7.6 km/h |
| December | 30°C | 21.6°C | 8 h/day | 115.6 mm | 7 | 79% | 7.6 km/h |
North (Pamplemousses)
| Month | High | Low | Sunshine | Rain | Rain days | Humidity | Wind |
|---|---|---|---|---|---|---|---|
| January | 31.1°C | 22.1°C | 8.1 h/day | 206.2 mm | 16 | 82% | 10.4 km/h |
| February | 30.8°C | 22.2°C | 7.7 h/day | 239.9 mm | 16 | 84% | 11.9 km/h |
| March | 30.6°C | 21.7°C | 7.6 h/day | 158.9 mm | 15 | 83% | 10.4 km/h |
| April | 29.8°C | 20.8°C | 7.4 h/day | 157.6 mm | 15 | 84% | 9.6 km/h |
| May | 28.1°C | 18.6°C | 7.6 h/day | 99.2 mm | 12 | 83% | 9.3 km/h |
| June | 26.5°C | 16.7°C | 7.4 h/day | 68.1 mm | 12 | 82% | 9.3 km/h |
| July | 25.7°C | 16.1°C | 7.6 h/day | 72.9 mm | 14 | 82% | 11.3 km/h |
| August | 25.9°C | 16.2°C | 7.7 h/day | 75.1 mm | 13 | 80% | 13.3 km/h |
| September | 27°C | 16.6°C | 7.5 h/day | 46 mm | 9 | 78% | 12.2 km/h |
| October | 28.4°C | 17.7°C | 8.2 h/day | 47.9 mm | 8 | 77% | 11.9 km/h |
| November | 30°C | 19.1°C | 8.7 h/day | 49.5 mm | 8 | 78% | 12.2 km/h |
| December | 30.7°C | 20.9°C | 8 h/day | 127.5 mm | 10 | 80% | 10.7 km/h |
East coast (Fuel)
| Month | High | Low | Sunshine | Rain | Rain days | Humidity | Wind |
|---|---|---|---|---|---|---|---|
| January | 28.8°C | 22°C | 7 h/day | 261.3 mm | 17 | 84% | 8 km/h |
| February | 28.7°C | 22.3°C | 6.6 h/day | 334.1 mm | 17 | 86% | 9.1 km/h |
| March | 28.6°C | 22°C | 6.7 h/day | 231.2 mm | 17 | 84% | 9.6 km/h |
| April | 27.6°C | 21.2°C | 6 h/day | 240 mm | 17 | 85% | 9.1 km/h |
| May | 26.2°C | 19.3°C | 6.3 h/day | 167.7 mm | 15 | 83% | 9.3 km/h |
| June | 24.6°C | 17.8°C | 6.1 h/day | 104 mm | 14 | 82% | 10.8 km/h |
| July | 23.7°C | 17.3°C | 6.1 h/day | 102.5 mm | 16 | 82% | 12.3 km/h |
| August | 23.8°C | 17°C | 6.1 h/day | 104.9 mm | 15 | 81% | 11.7 km/h |
| September | 24.3°C | 17.1°C | 6.3 h/day | 70.1 mm | 11 | 81% | 11.2 km/h |
| October | 25.4°C | 17.9°C | 6.8 h/day | 62.2 mm | 11 | 81% | 11 km/h |
| November | 27.1°C | 19.4°C | 7.3 h/day | 82 mm | 10 | 81% | 10.1 km/h |
| December | 28.2°C | 21°C | 7 h/day | 201.8 mm | 13 | 84% | 9.1 km/h |
South (Plaisance)
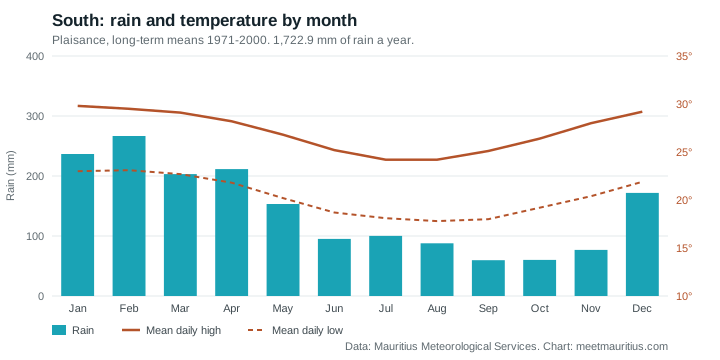
| Month | High | Low | Sunshine | Rain | Rain days | Humidity | Wind |
|---|---|---|---|---|---|---|---|
| January | 29.8°C | 23°C | 7.7 h/day | 236.6 mm | 16 | 81% | 11.4 km/h |
| February | 29.5°C | 23.1°C | 7.1 h/day | 266.6 mm | 16 | 83% | 9.5 km/h |
| March | 29.1°C | 22.7°C | 6.9 h/day | 203.1 mm | 17 | 83% | 9.5 km/h |
| April | 28.2°C | 21.8°C | 6.5 h/day | 211.5 mm | 17 | 83% | 9.5 km/h |
| May | 26.8°C | 20.2°C | 6.6 h/day | 153.4 mm | 14 | 81% | 11.4 km/h |
| June | 25.2°C | 18.7°C | 6.1 h/day | 95.2 mm | 14 | 78% | 11.4 km/h |
| July | 24.2°C | 18.1°C | 5.5 h/day | 100.2 mm | 16 | 77% | 13.3 km/h |
| August | 24.2°C | 17.8°C | 5.9 h/day | 87.9 mm | 15 | 78% | 15.2 km/h |
| September | 25.1°C | 18°C | 6.7 h/day | 59.6 mm | 10 | 77% | 13.3 km/h |
| October | 26.4°C | 19.2°C | 7.6 h/day | 60.1 mm | 9 | 77% | 11.4 km/h |
| November | 28°C | 20.4°C | 8.8 h/day | 76.9 mm | 10 | 78% | 11.4 km/h |
| December | 29.2°C | 21.9°C | 8.4 h/day | 171.8 mm | 12 | 80% | 11.4 km/h |
Central plateau (Vacoas)
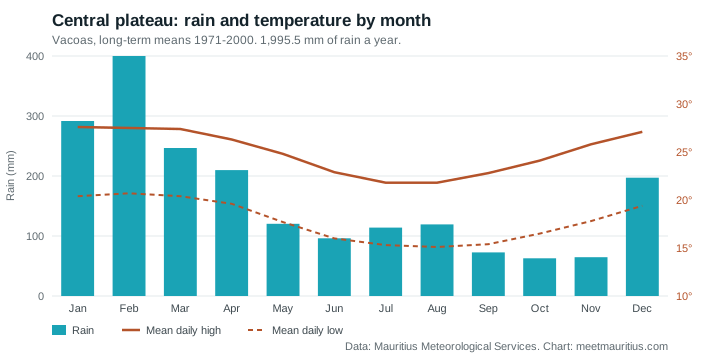
| Month | High | Low | Sunshine | Rain | Rain days | Humidity | Wind |
|---|---|---|---|---|---|---|---|
| January | 27.6°C | 20.4°C | 7.3 h/day | 291.6 mm | 16 | 83% | 9.5 km/h |
| February | 27.5°C | 20.7°C | 6.9 h/day | 400.2 mm | 18 | 85% | 9.5 km/h |
| March | 27.4°C | 20.4°C | 7.3 h/day | 246.6 mm | 17 | 84% | 9.5 km/h |
| April | 26.3°C | 19.6°C | 6.9 h/day | 209.9 mm | 17 | 85% | 9.5 km/h |
| May | 24.8°C | 17.7°C | 7.4 h/day | 120.3 mm | 15 | 83% | 9.5 km/h |
| June | 22.9°C | 16°C | 7.2 h/day | 96.1 mm | 14 | 82% | 9.5 km/h |
| July | 21.8°C | 15.3°C | 7.3 h/day | 114 mm | 17 | 83% | 11.4 km/h |
| August | 21.8°C | 15.1°C | 7.2 h/day | 119.4 mm | 18 | 82% | 11.4 km/h |
| September | 22.8°C | 15.4°C | 7.3 h/day | 72.7 mm | 13 | 83% | 11.4 km/h |
| October | 24.1°C | 16.5°C | 7.6 h/day | 62.9 mm | 11 | 83% | 11.4 km/h |
| November | 25.8°C | 17.8°C | 7.9 h/day | 64.7 mm | 10 | 83% | 11.4 km/h |
| December | 27.1°C | 19.4°C | 7.2 h/day | 197.1 mm | 13 | 82% | 9.5 km/h |
Cyclone season
The cyclone season usually runs from November to May, and most cyclones that affect Mauritius come between January and March, the wettest stretch in the tables above. The Mauritius Meteorological Services issue the warnings, from Class I to Class IV; check their warning page when you're there in those months. Our best time to visit guide covers what that means for a trip, and our 2027 public holidays calendar shows the dates when beaches and roads are busiest.
About these figures
They are 30-year averages (1971-2000) published by the Mauritius Meteorological Services, one station for each of its five climate regions, so a single year can be wetter, drier, warmer or cooler. The stations sit inland of the resort towns we name, so the beaches can be a little warmer and breezier. Wind is the mean speed; sunshine is hours of bright sun a day. We copied the numbers into our tables and drew our own charts.
Not covered: sea temperature, which the MMS tables don't include, and Rodrigues, which has no table in the same series. For the weather this week, see the MMS forecast at metservice.intnet.mu.
Download and cite
- Download the data as a spreadsheet (CSV), all five regions, one row per month.
- Cite it as: Meet Mauritius, "Mauritius weather by month and by coast", from Mauritius Meteorological Services long-term means 1971-2000. https://www.meetmauritius.com/weather/mauritius-weather-by-month
- Source: Mauritius Meteorological Services, regional climate tables: West , North , East , South , Centre .